Section outline
-
labels.jpg is an image containing four plots similar to the one below:
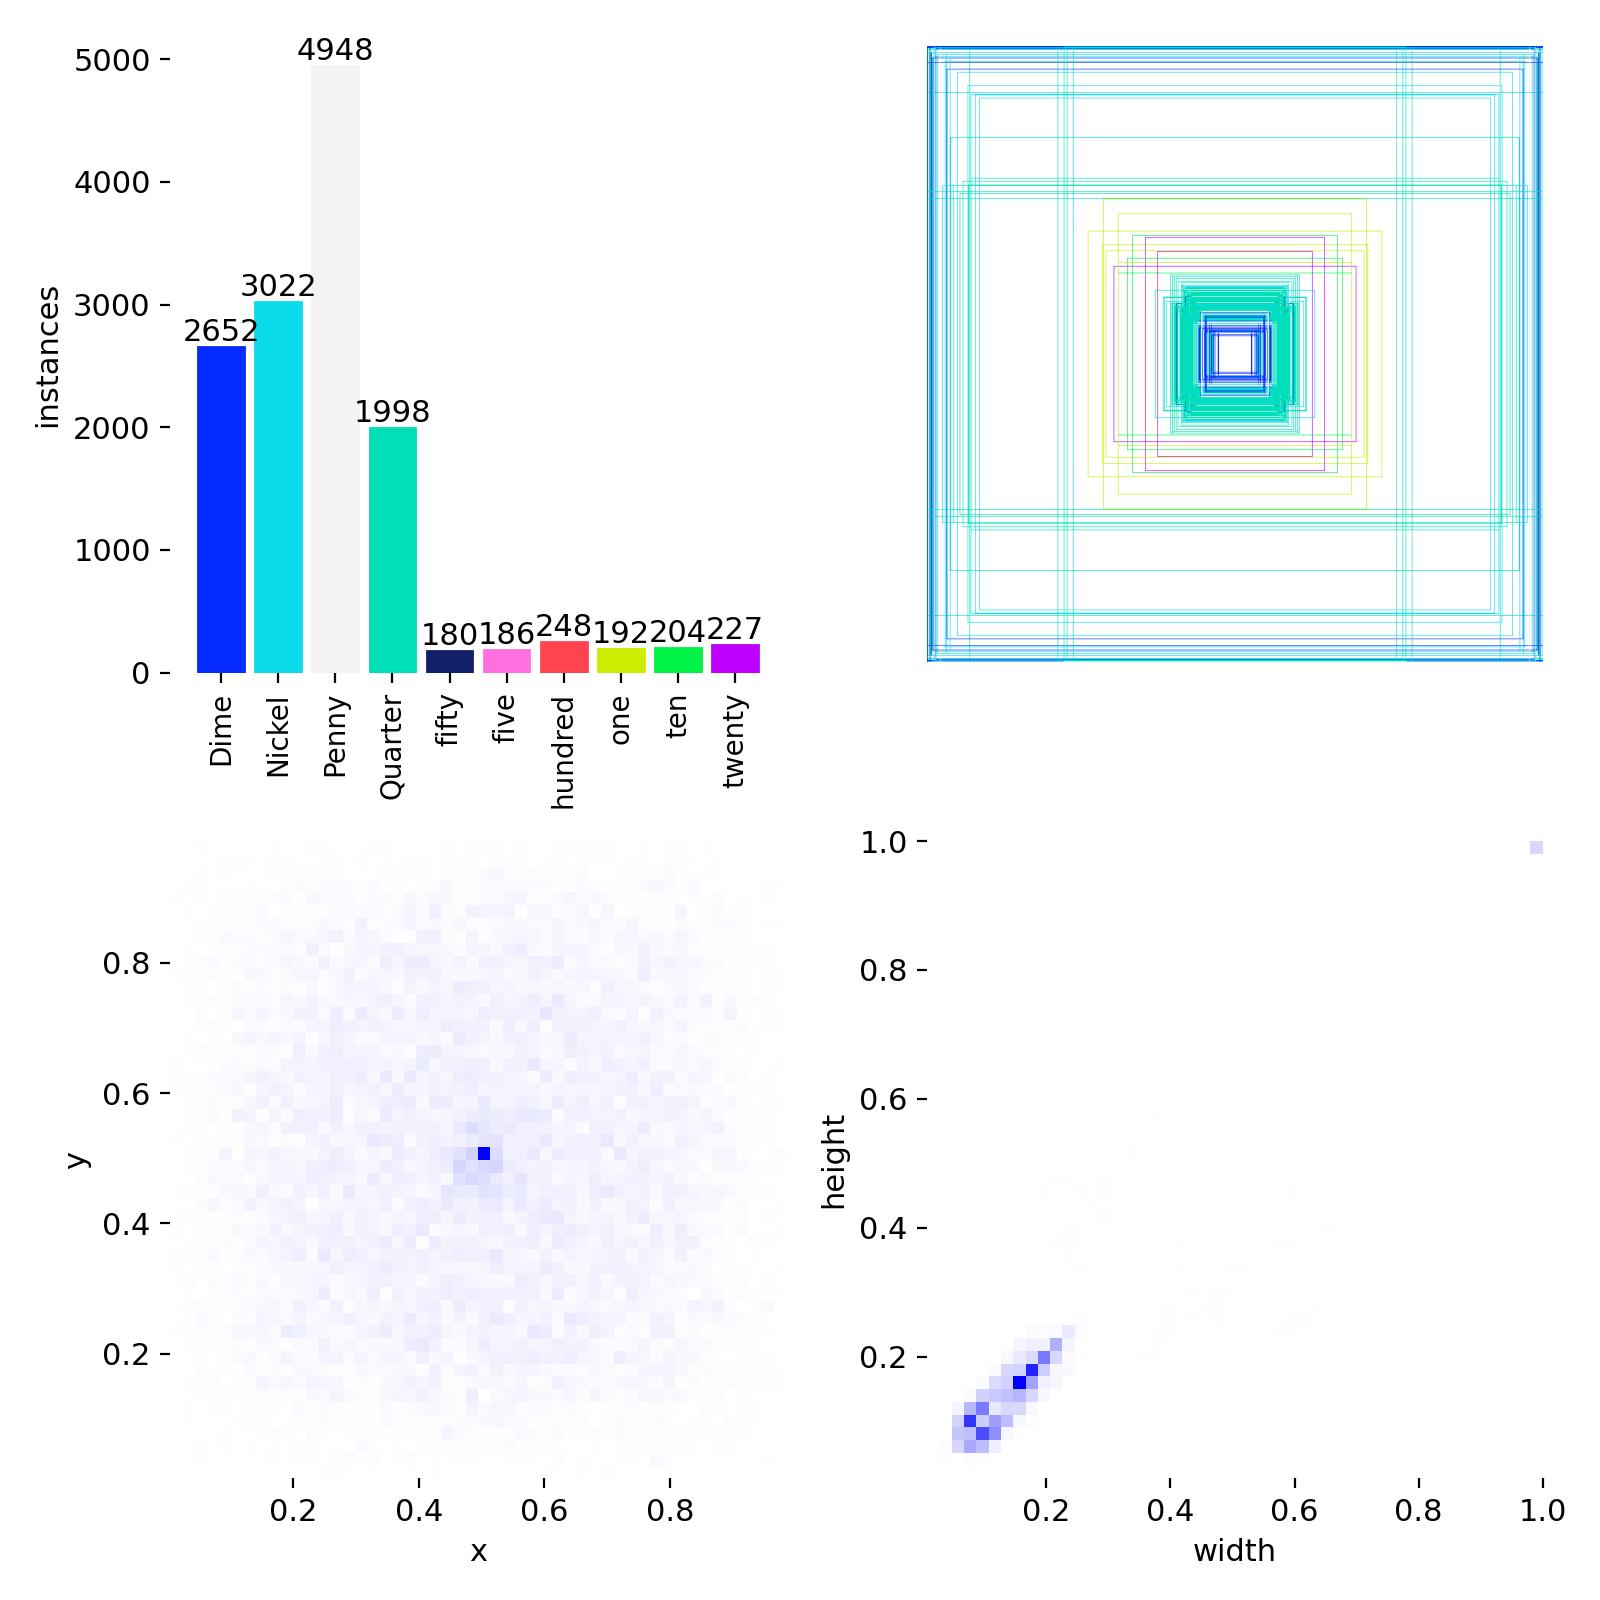
Top left: distribution of the different classes.
Top right: overlay of all bounding boxes.
Bottom left: coordinates of the centers of the bounding boxes.
Bottom right: dimensions of the bounding boxes.
These are statistics about the annotated data; this file is independent of training.