Section outline
-
The precision-recall curve shows the simultaneous evolution of precision and recall depending on the confidence threshold. It is built in a very specific way, which we will explain just after.
The F1-score is the harmonic mean of precision and recall. This curve is used to find the optimal confidence threshold for deploying your model.
-
-
-
-
Precision-Recall
-
-
-
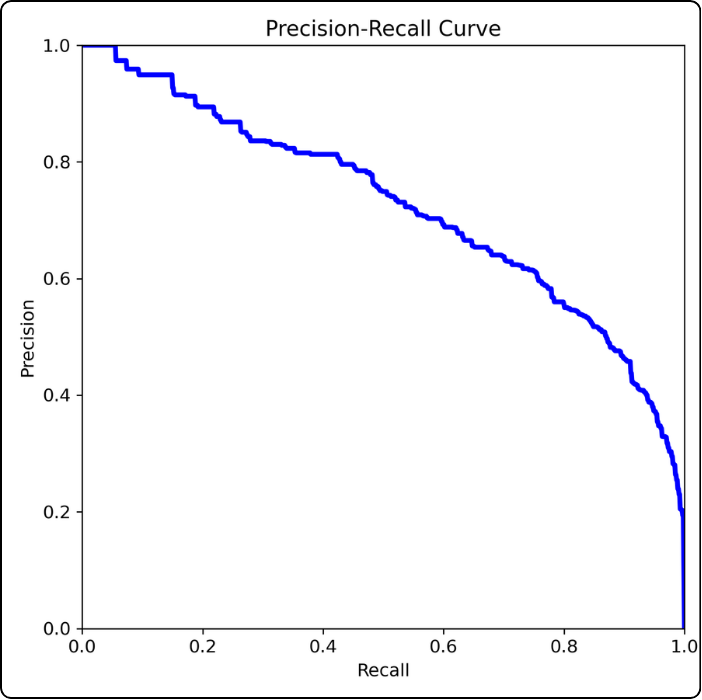
How to build it? This curve is constructed point by point because a third dimension is hidden: the confidence threshold.
We start with the leftmost point: this point corresponds to the precision and recall values when the confidence threshold is 1.
Then we plot the next point to the right: we take a threshold of 0.99 and compute precision and recall from the confusion matrix. And so on.
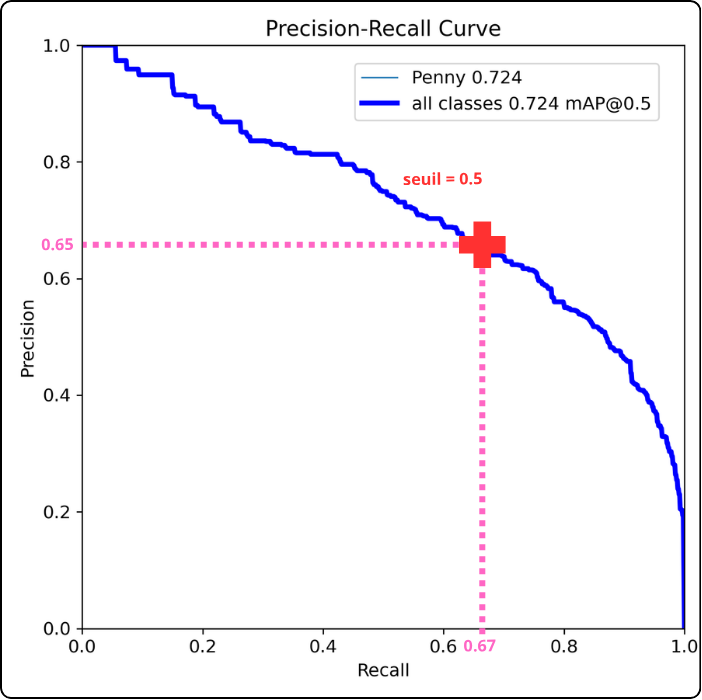
How to read it? For example, consider the point where the confidence threshold is 0.5 (if you stretch the curve between your fingers, this would be the middle). At this threshold, we can read a precision of about 0.65 and a recall of about 0.67.
Key takeaway: the closer the curve gets to the top-right corner, the better the model performs (this example model is actually quite poor, so don’t rely on it).
Going further:
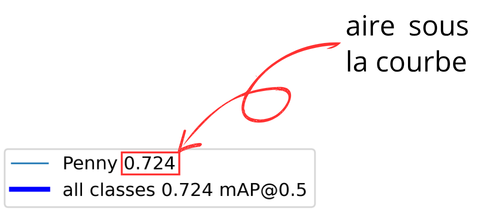
The precision-recall curve is used to compute another metric that you will encounter in the results: Average Precision (AP). This metric corresponds to the area under the precision-recall curve. It is the decimal value shown next to each class name in the legend.
By extension, mAP stands for mean Average Precision, which is the average of AP values when multiple classes are involved.
Why is this useful? As mentioned earlier, “getting closer to the top-right corner” is subjective. AP was introduced to quantify how high the curve rises, i.e., how large the area under the curve is. The higher the AP or mAP, the better the model.
Going even further:
After “mAP”, you may see “@0.5”, which corresponds to the threshold value for Intersection over Union (IoU).
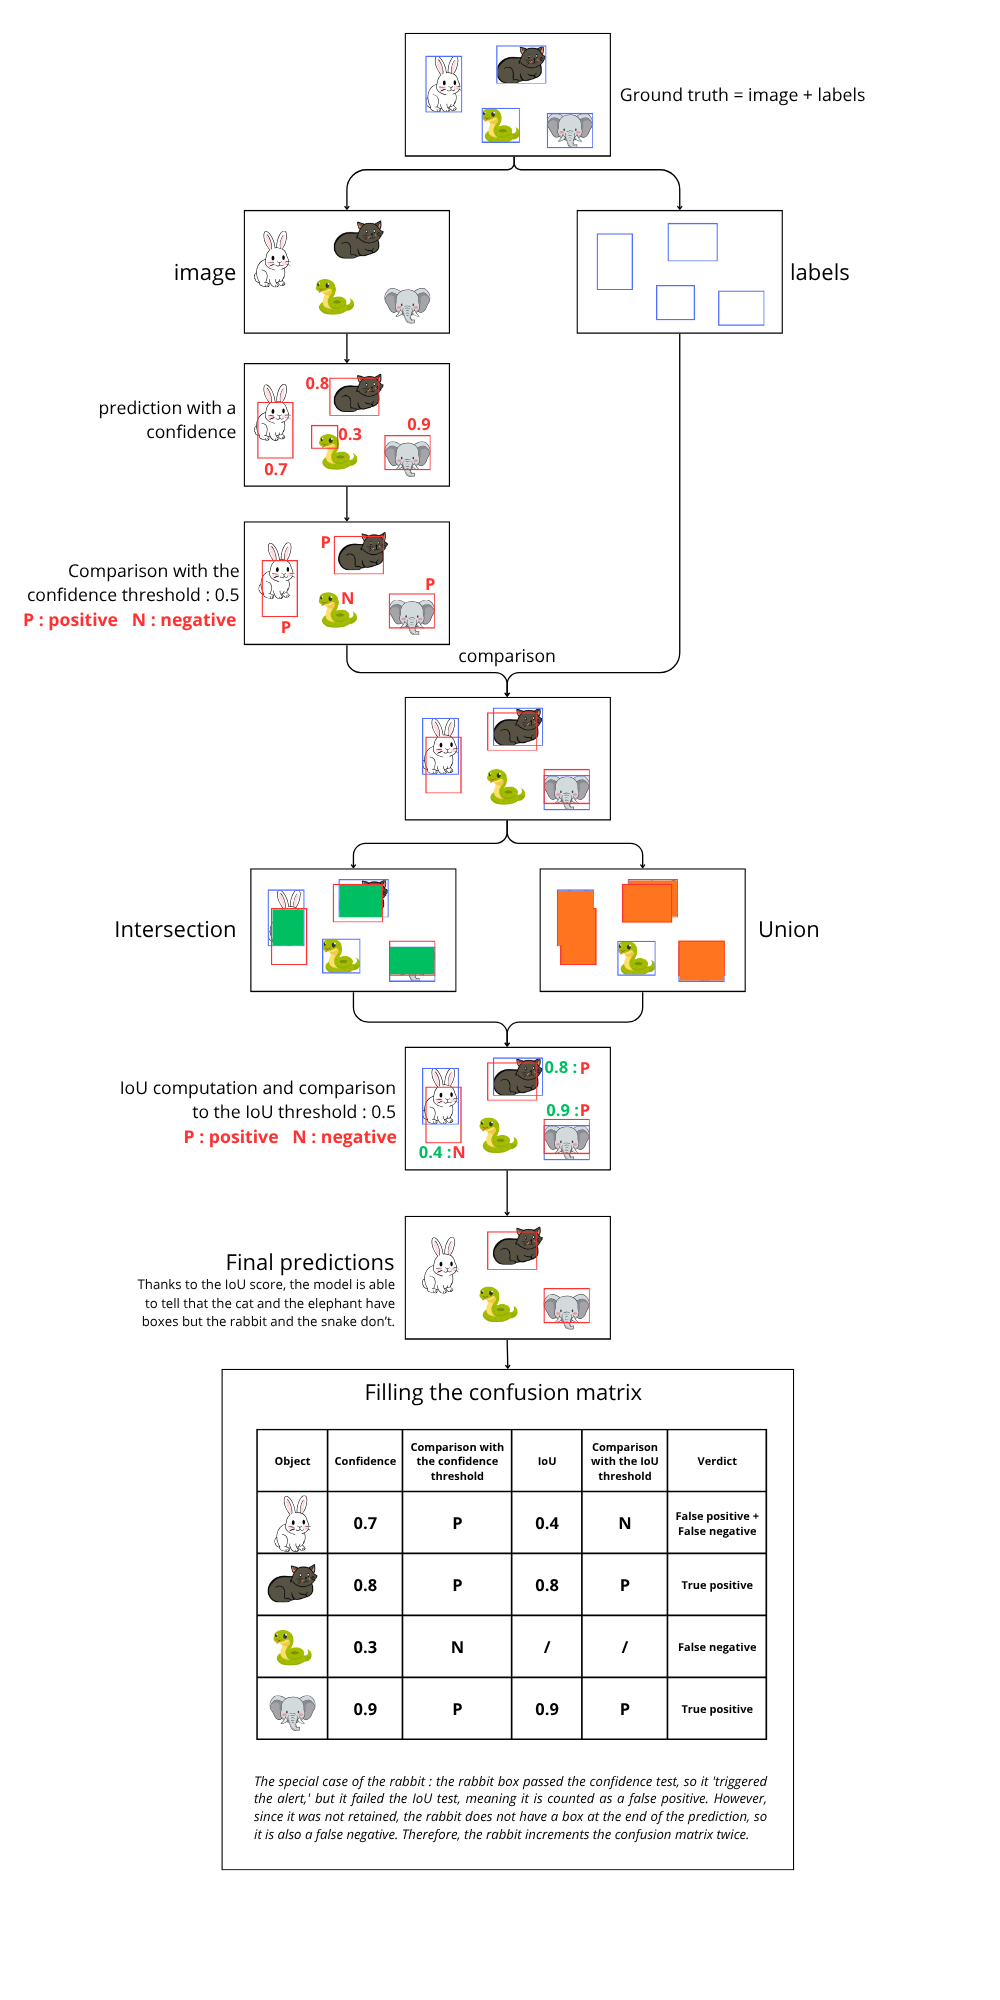
To understand IoU, think of it as a verification tool for the model: the model predicts a bounding box, and there is also a ground-truth bounding box. We need a way to quantify how well the predicted box matches the true one.
Consider the two boxes below:

The green box represents ground truth, and the orange box is the model’s prediction. It is not perfectly placed, but it still roughly covers the same object.
To measure this, we compute the ratio between the intersection and the union of the two boxes, as illustrated below:
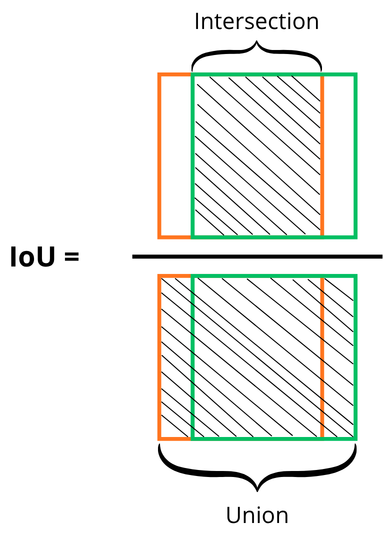
A threshold must be chosen to accept or reject predictions. For example, with an IoU threshold of 0.5, a predicted box must overlap the ground-truth box by at least 50% to be considered valid.
What is the difference between confidence and IoU?
Step 1: choose thresholds (arbitrarily):
- confidence threshold = 0.5
- IoU threshold = 0.5
Step 2: the model trains, processes images, and produces predictions with associated confidence scores.
Step 3: based on the confidence threshold, the model accepts predictions above the threshold and rejects the others.
Step 4: verification phase. Predicted boxes are compared to ground-truth boxes using IoU:
- If IoU ≥ threshold → true positive
- If IoU < threshold but passed confidence → false positive
Step 5: ground-truth boxes with no matching prediction are counted as false negatives.
The key difference is that the IoU threshold is only used during training, whereas the confidence threshold is crucial during deployment.
The diagram below explains what si going on with an image :
Another metric you may encounter is mAP50-95. It computes mAP across IoU thresholds from 0.5 to 0.95 (step 0.05) and takes the average.
This metric is particularly useful because it is stricter about bounding-box accuracy, making it a standard benchmark in computer vision.
-
-
-
-
F1-score
-
-
-
The F1-score is the harmonic mean of precision and recall:

One key advantage of F1 is its sensitivity to extreme values. A model with perfect precision but very low recall will still get a poor F1 score.
This curve is used to find the optimal confidence threshold: it corresponds to the x-value of the maximum point on the curve.
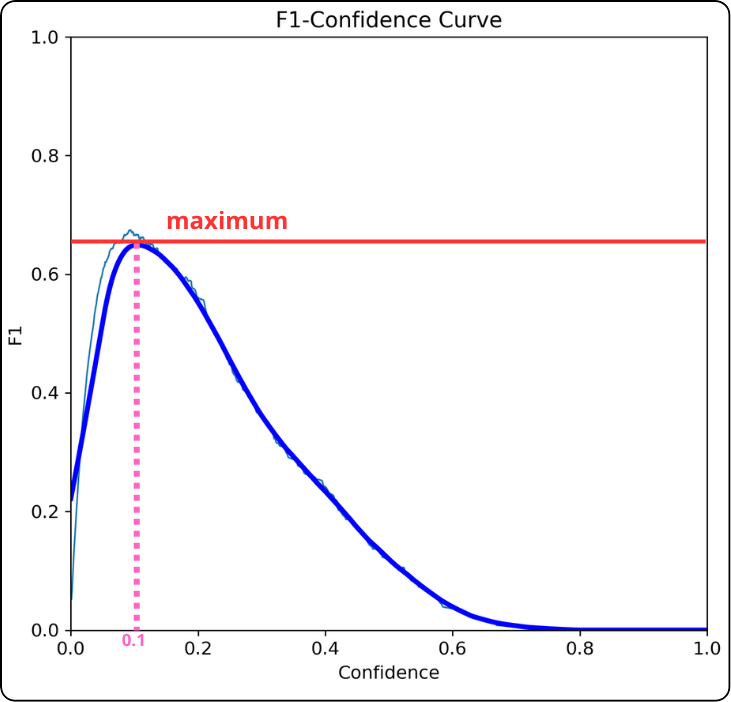
Key takeaway: the x-value at the maximum is a good candidate for your confidence threshold.
If the F1 curve forms a plateau instead of a sharp peak:
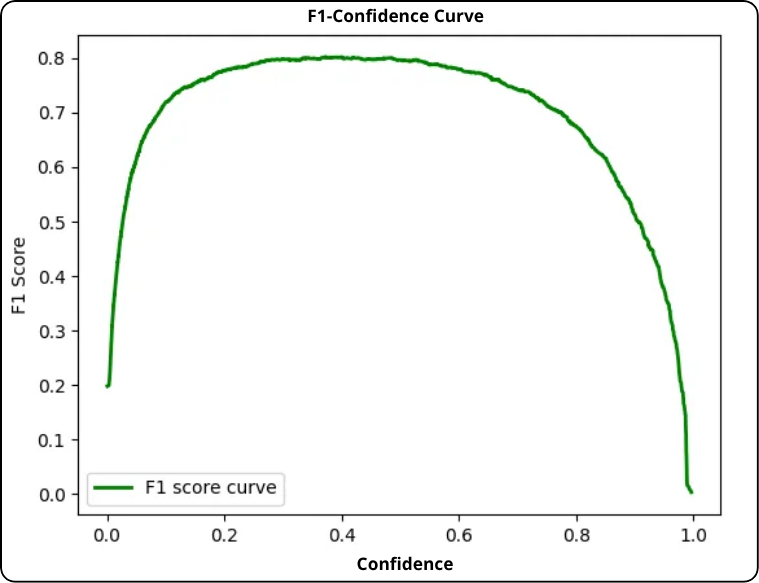
- Prioritize precision (avoid false positives): choose the right end of the plateau (higher threshold).
- Prioritize recall (avoid false negatives): choose the left end (lower threshold).
- Balanced approach: choose the center of the plateau.
-