Section outline
-
Let’s visualize these metrics using a diagram:
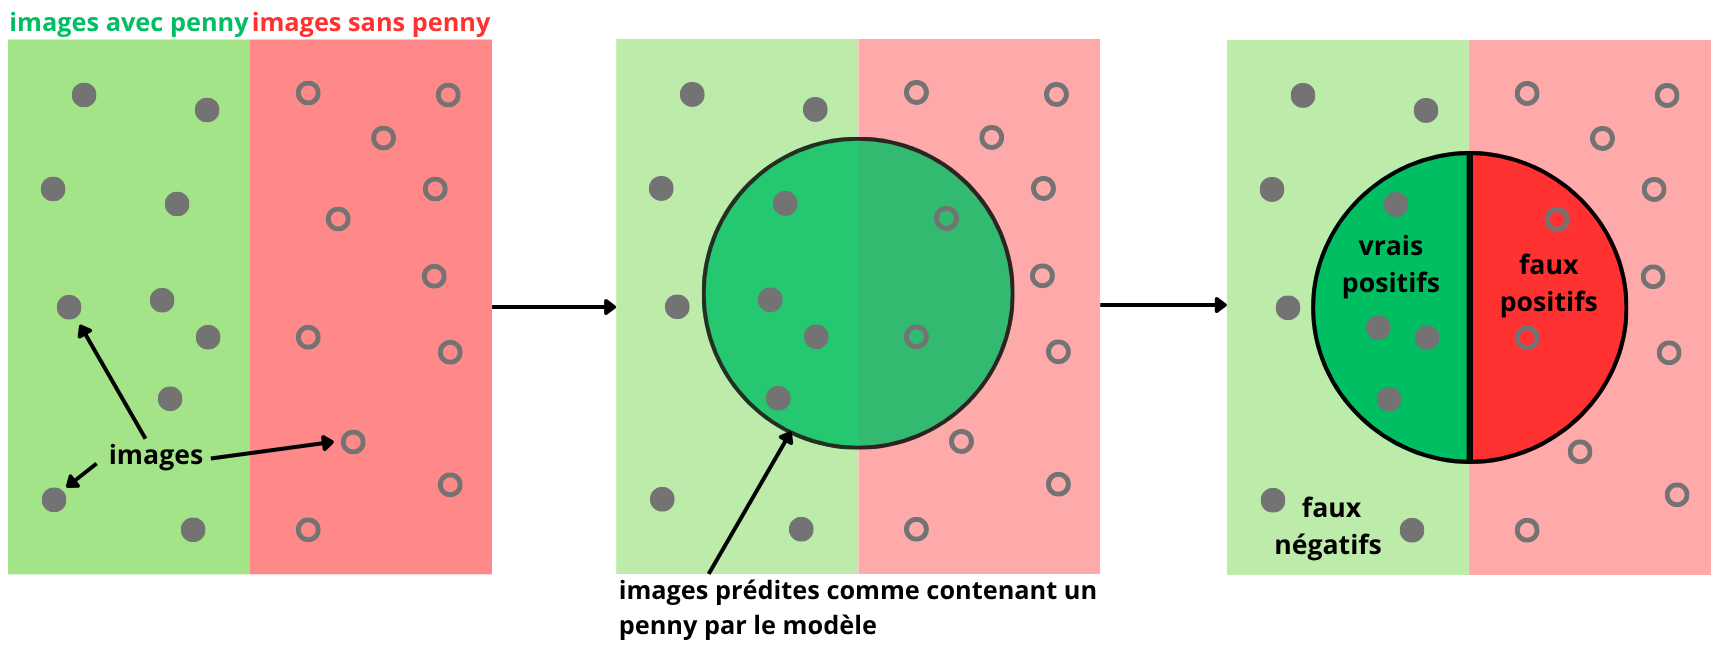
Using the previous diagram, we can express precision and recall as follows:
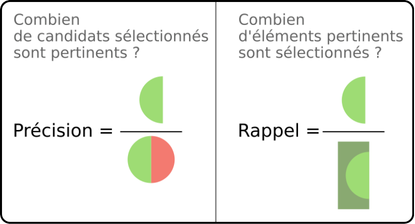
Mathematically, this can be formalized as follows:


It is therefore possible to plot curves to observe how these metrics evolve as a function of the confidence threshold.
Precision–Confidence
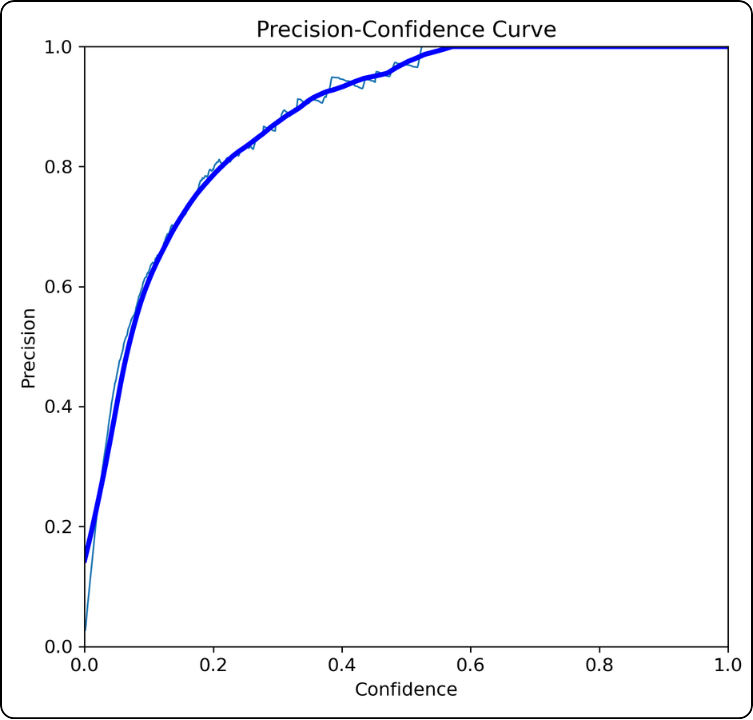
How is it constructed? For all confidence thresholds between 0 and 1:
- compute the confusion matrix for that threshold
- compute the precision associated with this specific matrix
- plot the point on the graph
How should it be interpreted? For example, at a confidence threshold of 0.4, the precision is around 0.92. This indicates that at this threshold, there are relatively few false positives.
Key takeaway: the higher the curve, the better the model.
Further insight:
This curve must be interpreted carefully because it does not account for false negatives. Moreover, as the threshold increases, fewer predictions are considered, so the increase in precision can be somewhat “artificial”.
This happens because the model becomes very selective. For example, if it only detects one true positive with 98% confidence, it will achieve 100% precision, even though many true positives (below the threshold) are missed.
Recall–Confidence
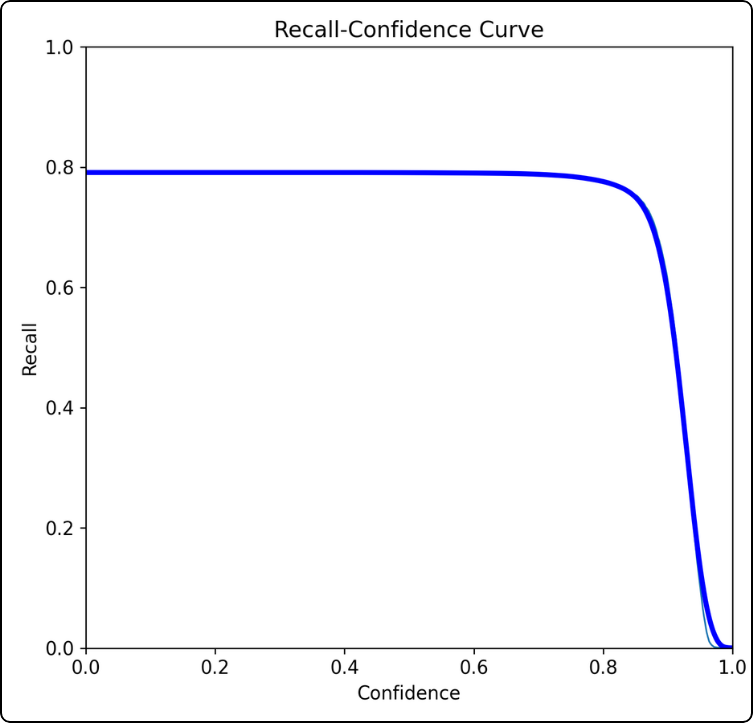
How is it constructed? For all confidence thresholds between 0 and 1:
- compute the confusion matrix for that threshold
- compute the recall associated with this specific matrix
- plot the point on the graph
How should it be interpreted? For example, at a confidence threshold of 0.8, the recall is around 0.78. This indicates that at this threshold, there are many false negatives.
Key takeaway: the higher the curve and the longer it takes to drop, the better the model.
Further insight:
The curve will inevitably reach 0 because as the confidence threshold increases, the model becomes stricter and accepts fewer predictions. This leads to a sharp increase in false negatives, which drives the recall down.
Precision and recall are both useful metrics but they are complementary. To properly evaluate a model, both must be considered together, especially how one evolves relative to the other.
To avoid constantly switching between the two graphs, combined metrics are used. We will therefore introduce the precision–recall curve and the F1-score in the next section.