Section outline
-
-
If you want to perform linear regressions, Seaborn provides a dedicated function: regplot().
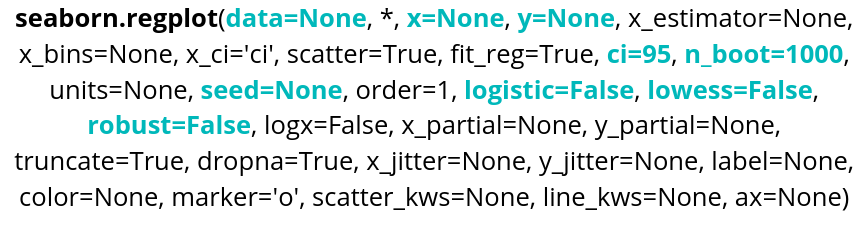
Parameter name Description Format Example data The dataframe you are working on
DataFrame, Series, dict, array, or list of arrays data=table x Variable for the x-axis String corresponding to a variable x="weight" y Variable for the y-axis String corresponding to a variable y=”height” ci Variable allowing to control the confidence interval displayed Integer between 1 and 100 ci=99 nboot Variable indicating the number of bootstrap resampling that will be done Integer nboot=100 seed Variable to indicate a seed for the resampling, allows reproductibility Integer seed=42 logistic Variable allowing to do a logistic regression Boolean logistic=True lowess Variable allowing to do a lowess regression Boolean lowess=True robust Variable allowing to do a robust regression Boolean robust=True regplot() also allows you to display the confidence interval, which is set to 95% by default.
Here is an example of code:
sns.regplot(data=data, x="bill_length_mm",y="bill_depth_mm", ci=70)
plt.show()
We can change the type by selecting a parameter, for example the lowess parameter, and setting it to True: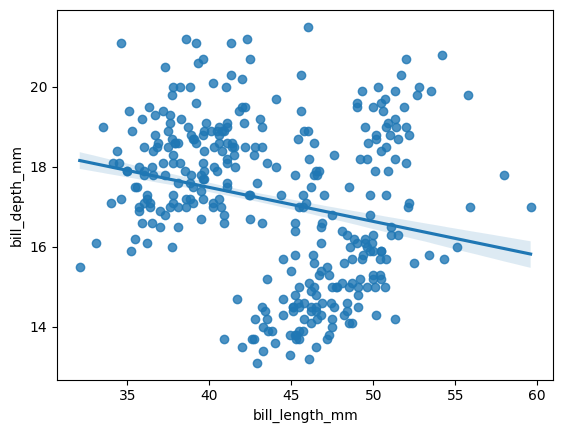
sns.regplot(data=data, x="bill_length_mm", y="bill_depth_mm",
 ci=99, lowess=True)
plt.show()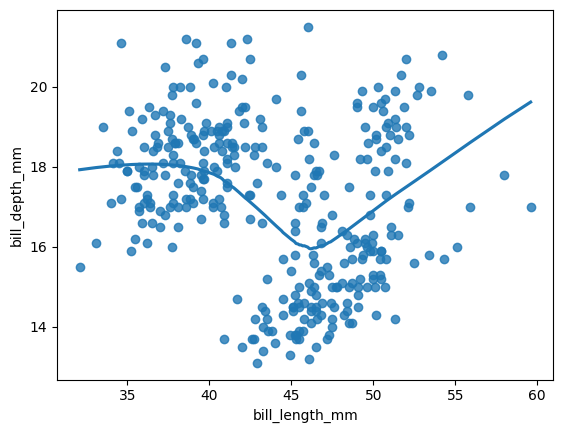
The confidence interval is not displayed when using LOWESS.
Another option is lmplot(), which is more suitable for performing regressions across multiple plots.
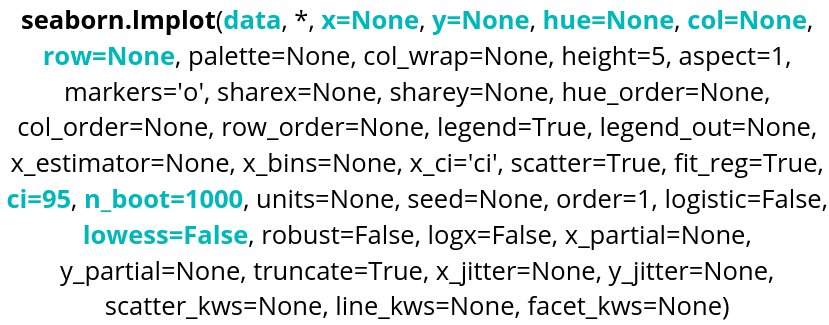
Parameter name Description Format Example data The dataframe you are working on
DataFrame, Series, dict, array, or list of arrays data=table x Variable for the x-axis String corresponding to a variable x="weight" y Variable for the y-axis String corresponding to a variable y=”height” hue Allows to add a variable as different colors String corresponding to a variable hue=”age” row Allows to create a table of plots, controling the number of rows String corresponding to a variable row=”category” col Allows to create a table of plots, controling the number of columns String corresponding to a variable col=”job” ci Variable allowing to control the confidence interval displayed Integer between 1 and 100 ci=99 nboot Variable indicating the number of bootstrap resampling that will be done Integer nboot=100 lowess Variable allowing to do a lowess regression Boolean lowess=True Here is an example of code:
sns.lmplot(data=data, x="bill_length_mm", y="bill_depth_mm", ci=95, hue="island", robust=True, col="sex")
plt.show()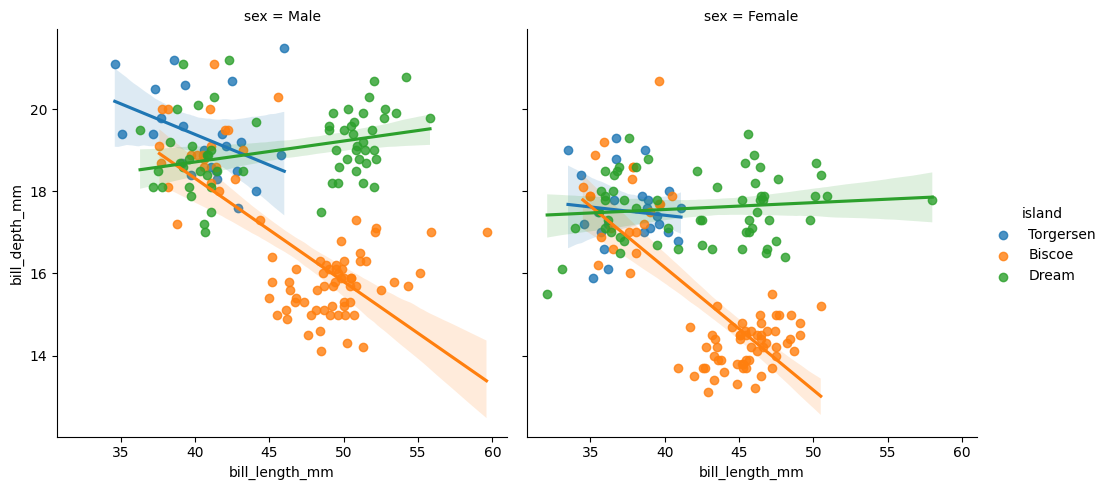
Robust and logistic regressions are also available, as with regplot(). nboot and seed are also available.
-