Section outline
-
-
-
-
The catplot() function allows you to create different types of plots:
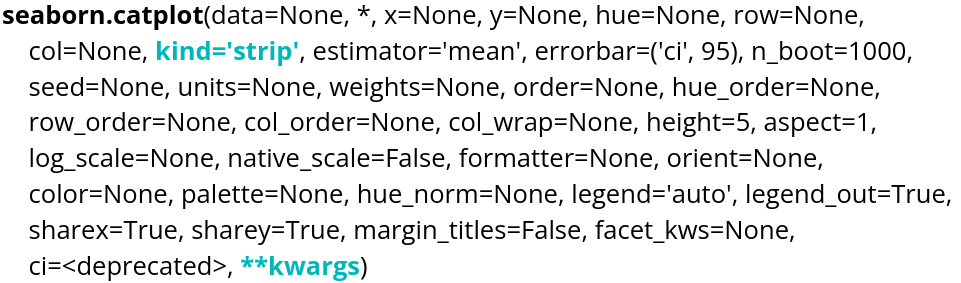
There are different kinds that we will present:
tips=sns.load_dataset("tips")
sns.catplot(tips,x="day", y="total_bill")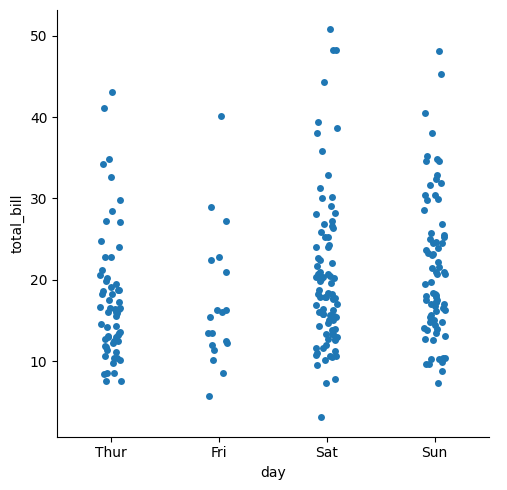
sns.catplot(tips,x="day", y="total_bill",kind="swarm")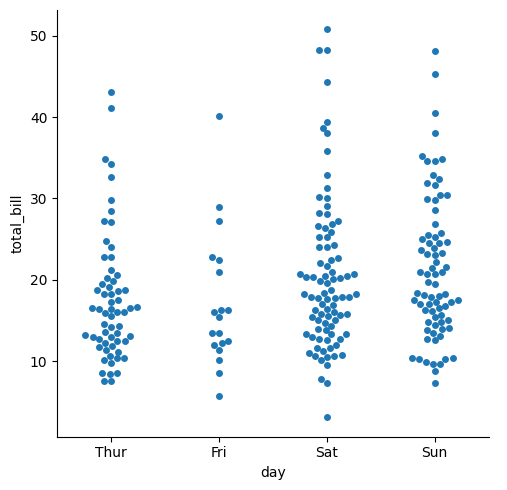
sns.catplot(tips,x="day", y="total_bill",kind="violin")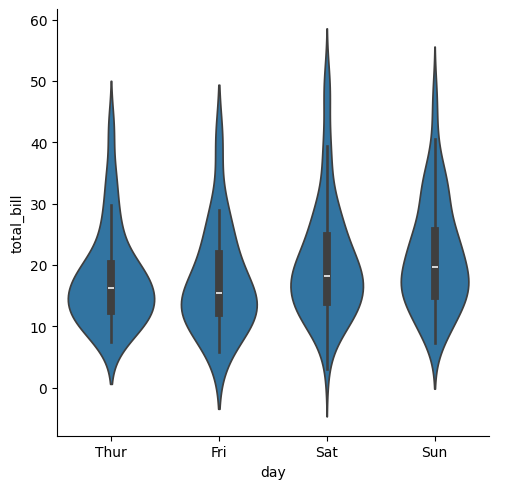
sns.catplot(tips,x="day", y="total_bill",kind="box")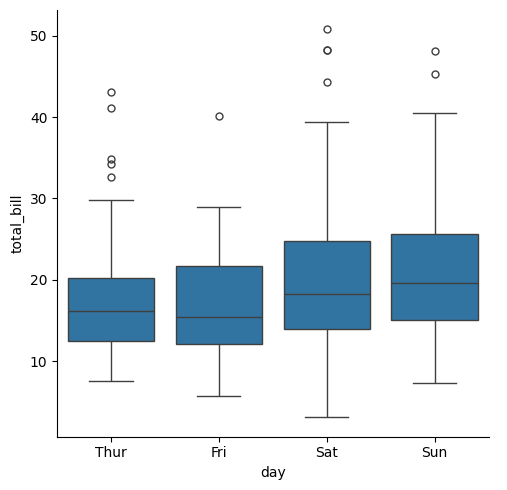
sns.catplot(tips,x="day", y="total_bill",kind="boxen")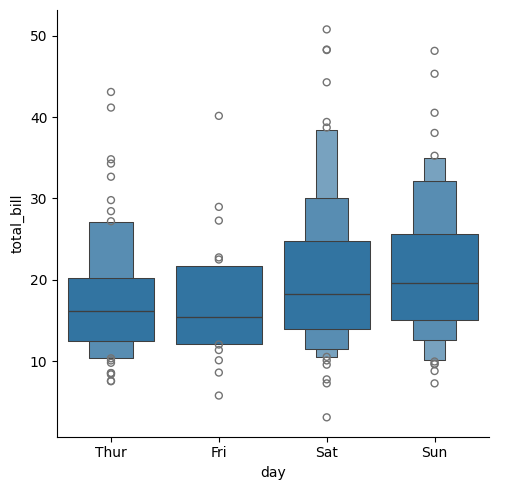
sns.catplot(tips,x="day", y="total_bill",kind="point")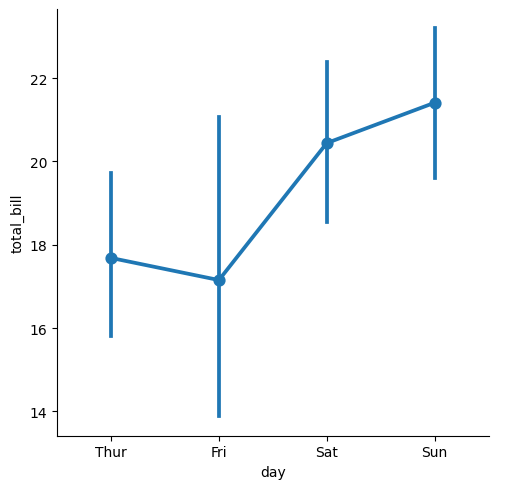
sns.catplot(tips,x="day", y="total_bill",kind="bar")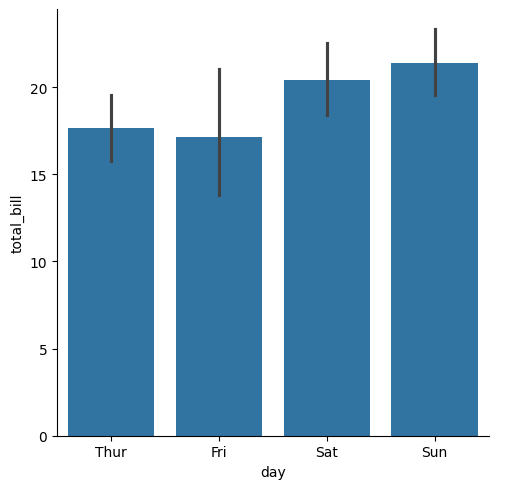
sns.catplot(tips,x="day",kind="count")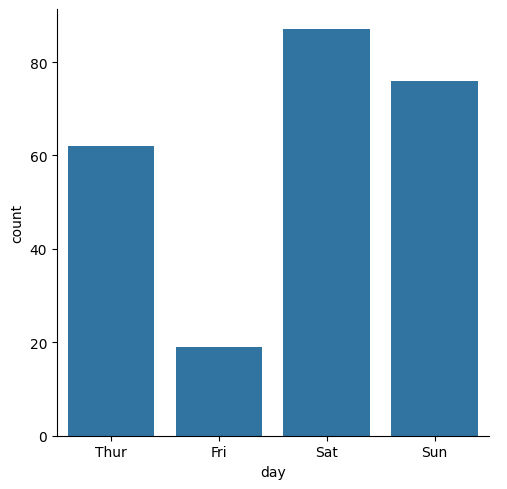
We can use the parameters of the chosen methods. For example, boxplot() has a fill parameter, so it can be specified in the catplot() function.
sns.catplot(kind="box",data=tips,x="smoker",y="total_bill",fill=False)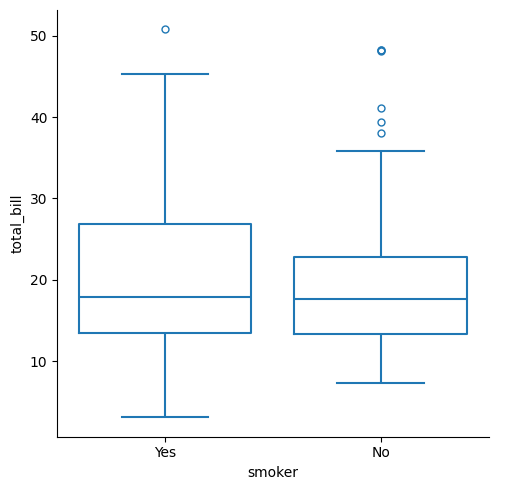
-
-