Section outline
-
-
If you want to perform linear regressions, Seaborn provides a dedicated function: regplot().
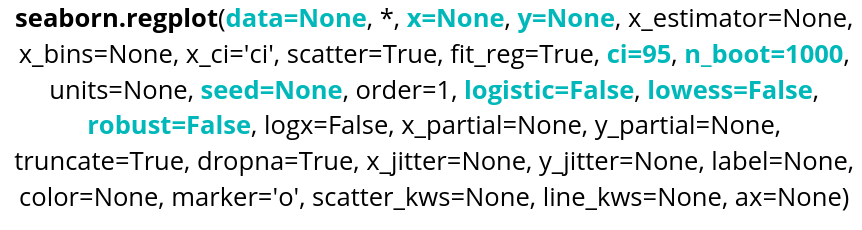
Parameter name Explanations Required type Example data Table you are planning to use
DataFrame, Series, dict, array, or list of arrays data=table x Variable of the table for the x-axis string corresponding to a variable of the table x="weight" y Variable of the table for the y-axis string corresponding to a variable of the table y=”height” ci Variable allowing to control the confidence interval Integer between 1 and 100 ci=99 nboot Variable allowing to choose the number of bootstrap resampling done. Integer nboot=100 seed Variable allowing reproductibility by choosing the seed of the bootstrap. Integer seed=42 logistic Variable allowing to do a logistic regression Boolean logistic=True lowess Variable allowing to do a LOWESS regression Boolean lowess=True robust Variable allowing to do a robust regression. Higher computing cost Boolean robust=True
The confidence interval is not displayed when using LOWESS.
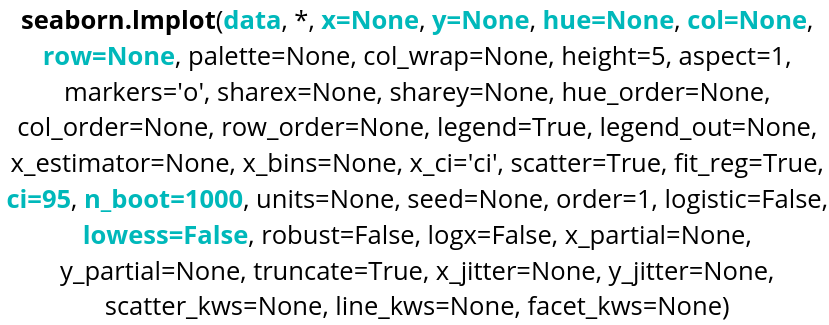
Parameter name Explanations Required type Example data Table you are planning to use
DataFrame, Series, dict, array, or list of arrays data=tableau x Variable of the table for the x-axis string corresponding to a variable of the table x="weight" y Variable of the table for the y-axis string corresponding to a variable of the table y=”height” hue Variable of the table to distinguish with colors string corresponding to a variable of the table hue=”age” row Variable of the table that will be used to make different plots, in rows string corresponding to a variable of the table row=”category” col Variable of the table that will be used to make different plots, in columns string corresponding to a variable of the table col=”job” ci Variable allowing to control the confidence interval Integer between 1 and 100 ci=99 nboot Variable allowing to choose the number of bootstrap resampling done. Integer nboot=100 lowess Variable allowing to do a LOWESS regression Boolean lowess=True Here is an example of code:
Robust and logistic regressions are also available, just as with regplot(). The nboot and seed parameters are also available.
-