Section outline
-
-
Seaborn is a Python library used to create data visualizations (charts) in a simple and aesthetically pleasing way.
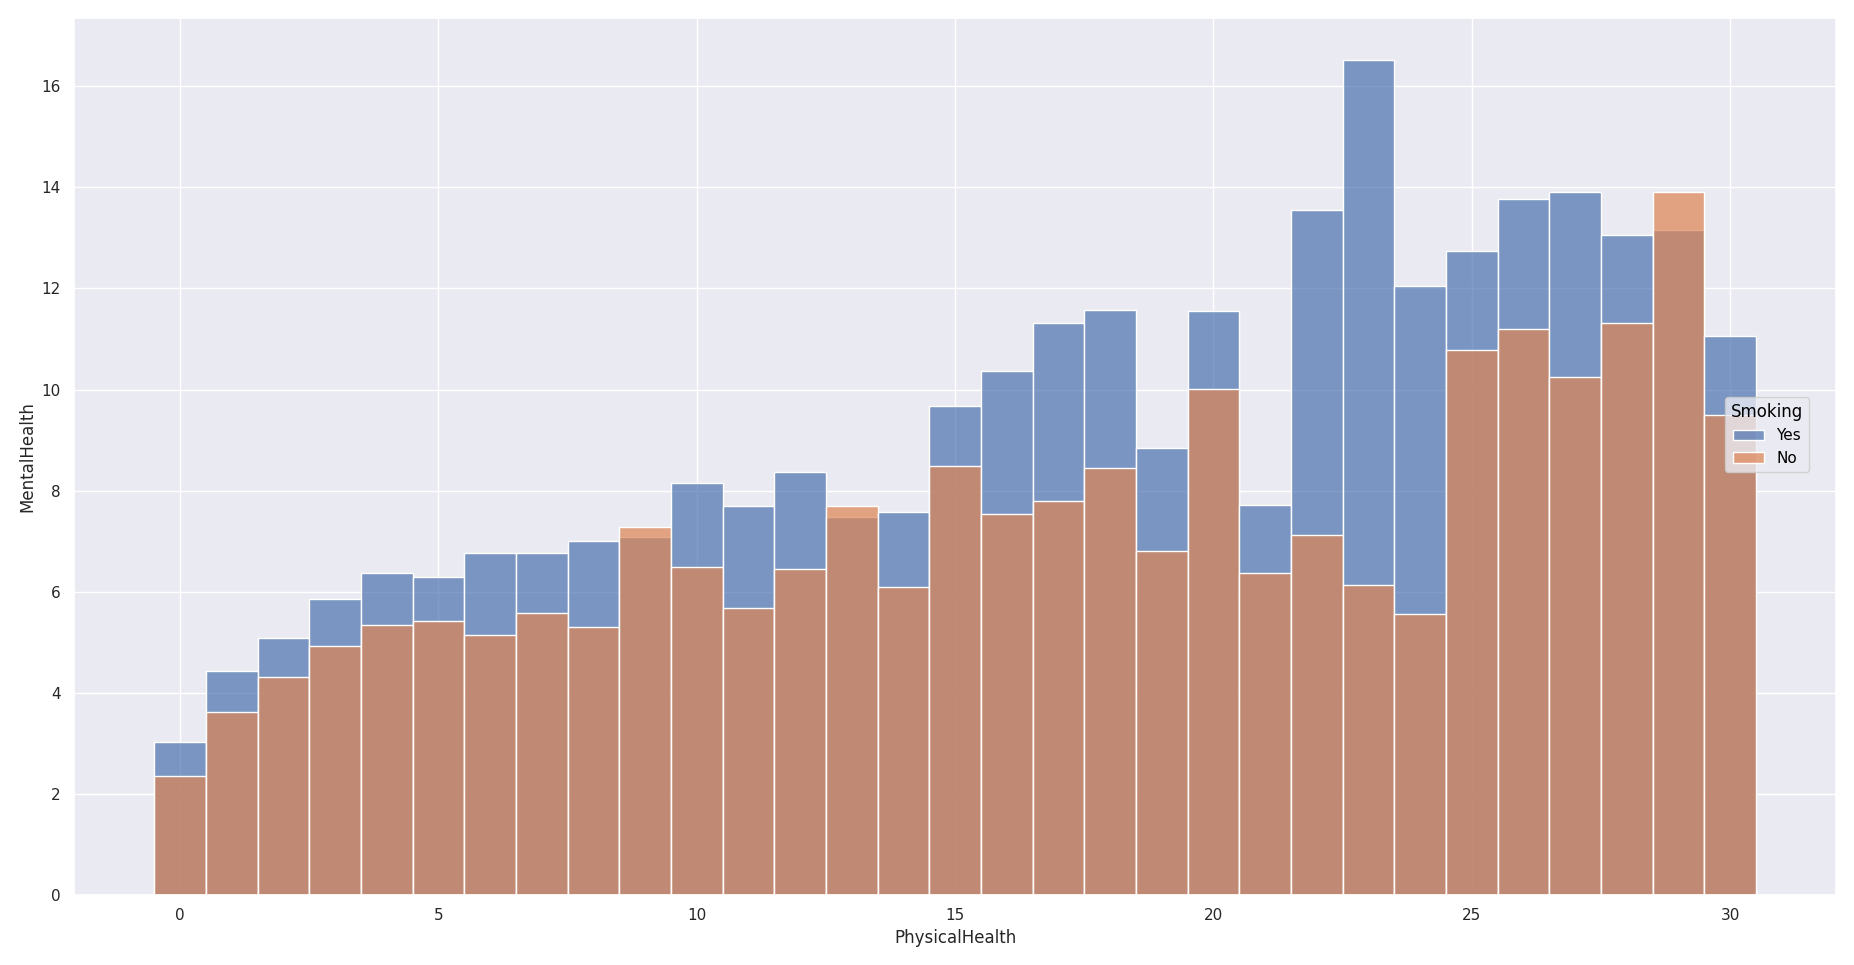
This library can typically be used to analyze health data. Here is an example in which respondents were asked, over the previous 30 days, how many days they considered themselves to have been in poor physical health, and likewise for their mental health, with color indicating whether or not they are smokers.
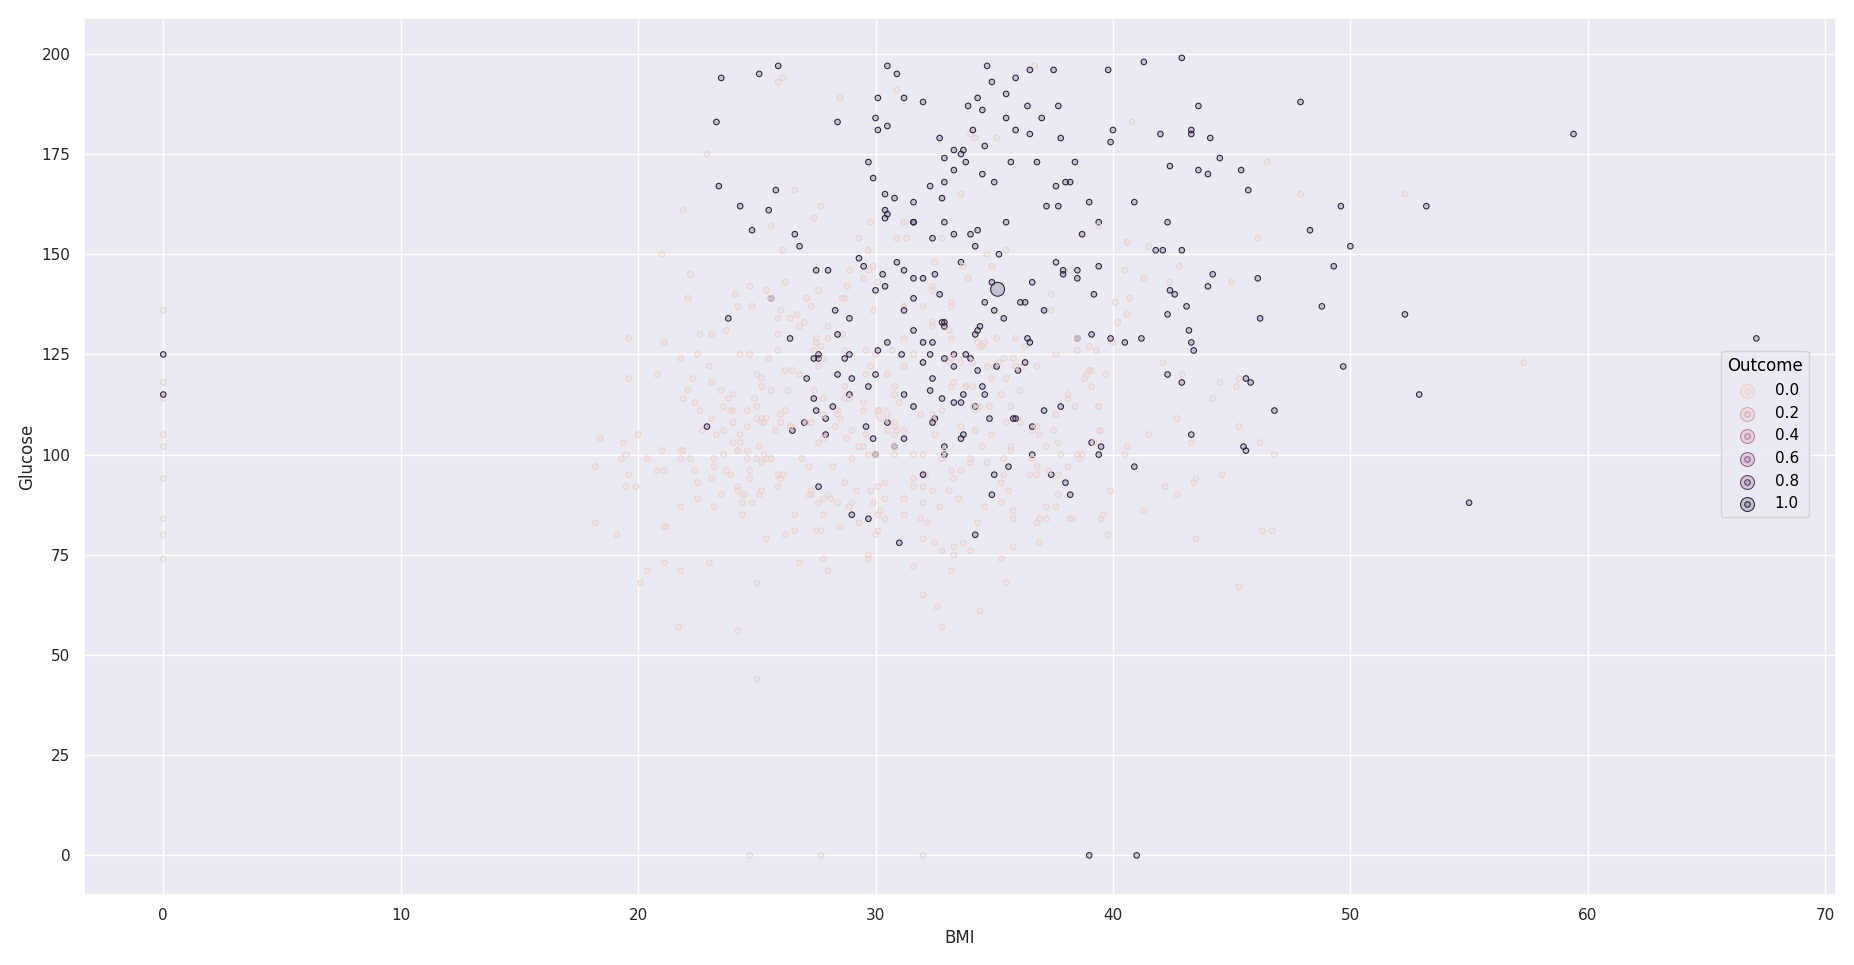
Here is another example showing blood glucose levels according to body mass index (BMI), with people suffering from diabetes shown in black.
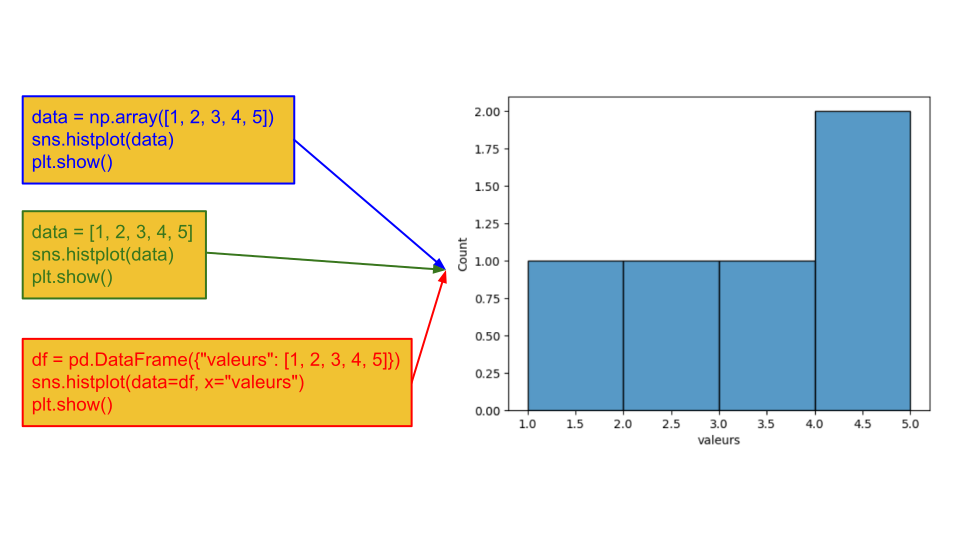
Seaborn can be used with different types of data, including Python lists, NumPy arrays, and pandas DataFrames, although pandas DataFrames are generally preferred.
There are different formats for data tables:
Wide-format :
Var1 Value1 Value2 Value3 Var2 Value1 Var3Val11 Var3Val12 Var3Val13 Value2 Var3Val21 Var3Val22 Var3Val23 Value3 Var3Val31 Var3Val32 Var3Val33 The wide format is often more natural for humans, and some algorithms or functions expect data in this format. Here is an example:
Day Temp_Paris Temp_Lyon Monday 20 23 Tuesday 19 24 Long-format :
Var1 Var2 Var3 Observation1 Var1Val1 Var2Val1 Var3Val1 Observation2 Var1Val2 Var2Val2 Var3Val2 Observation3 Var1Val3 Var2Val3 Var3Val3 The standard format is the long format, which allows data points to be represented using multiple different variables. Here is the previous example in long format:
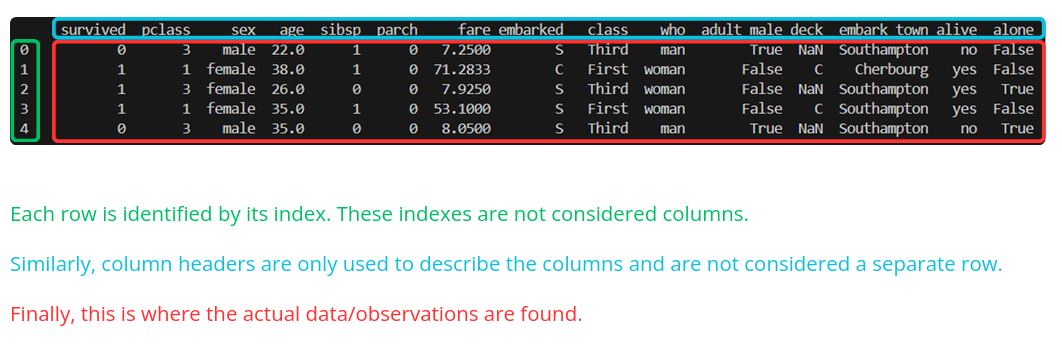
Day City Temperature Monday Paris 20 Monday Lyon 23 Tuesday Paris 19 Tuesday Lyon 24 Here is a description of a table in this format:
It can be useful to check whether any data is missing, particularly if certain algorithms cannot handle missing values or if they could bias the results. Having complete data can also make tasks such as data aggregation easier. Here is the code used to check for missing data:
data=sns.load_dataset("penguins")
print(data.isnull())#on the whole table
print(data.isnull().any())#on each column
Then, if we do not want to consider observations with missing values for a given variable, for example:
data.dropna(subset=["body_mass_g"])However, caution should be exercised when working with a relatively small dataset. For example, if the missing values consistently occur in the same variable, this may introduce bias. Ultimately, the decision depends on the user's judgment.
penguins.csv
species
island
bill_length_mm
bill_depth_mm
flipper_length_mm
body_mass_g
sex
Adelie
Torgersen
39.1
18.7
181
3750
MALE
tips.csv
total_bill
tip
sex
smoker
day
time
size
16.99
1.01
Female
No
Sun
Dinner
2
iris.csv
sepal_length
sepal_width
petal_length
petal_width
species
5.1
3.5
1.4
0.2
setosa
healthexp.csv
Year Country Spending_USD Life_Expectancy 1970 Germany 252.311 70.6 glue.csv
Model Year Encoder Task Score ERNIE 2019 Transformer CoLA 75.5 diamonds.csv
carat cut color clarity depth table price x y z 0.23 Ideal E SI12 61.5 55 326 3.95 3.98 2.43
-