Section outline

        •  
          What is qualitative data?
           

          Qualitative, or categorical, data are, in contrast to quantitative data, data that do not represent numerical measurements. They can include strings (for example, names) or Boolean values (True/False, yes/no, 1/0, etc.).

          Qualitative data can be plotted using the tools presented previously. However, there is an all-in-one tool that makes it easy to switch from one visualization type to another.


        •  

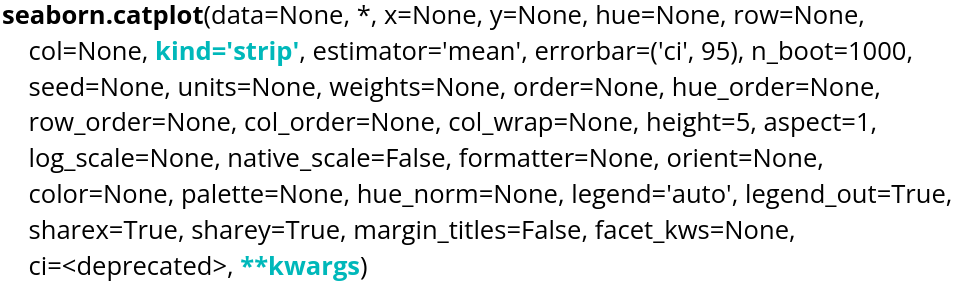
          The catplot() function allows you to create different types of plots:

          signature catplot


          Parameter name Explanations Type required Example
          data

          table you are planning to use

          DataFrame, Series, dict, array, or list of arrays data=table
          x variable of the table for the x-axis string corresponding to a variable of the table x="weight"
          y variable of the table for the y-axis string corresponding to a variable of the table y="height"
          kind type of plot desired string kind="swarm"

          There are several kind options that can be used:

          • strip
          • swarm
          • violin
          • box
          • boxen
          • point
          • bar
          • count

          Importation Code
          ← Running
          Cell 2
          ← Running

          The "point" and "bar" plots display the mean along with its confidence interval. These are calculated using bootstrap resampling.


          We can use the parameters of the selected plot types. For example, boxplot() has the fill parameter, so we can specify it directly in the catplot() function.

          Cell 3
          ← Running