Section outline
-
-
Since the release of Seaborn 0.12, the Seaborn Objects API has been introduced. It provides a powerful alternative to the original plotting functions. This API is inspired by ggplot2 in R.
We will use a simple example. First, we import the objects as follows:
import seaborn.objects as soso.Plot()To this function, we specify the data that we are going to use:
so.Plot(tips,x=”total_bill”)Here,
tipsis Seaborn'stipsdataset.Once the data has been specified, we can decide what to do with it using add(). Here, we create a histogram:
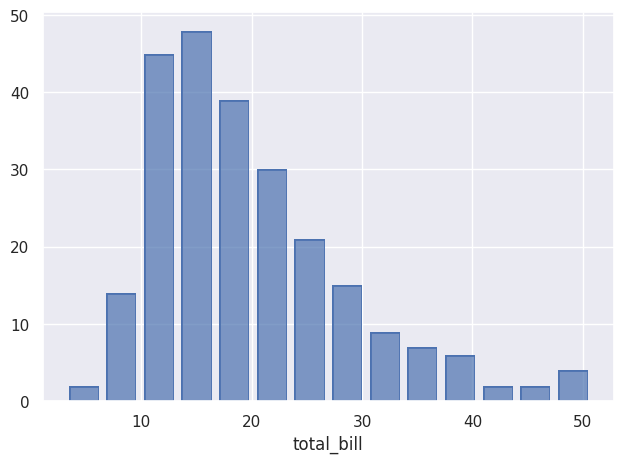
so.Plot(tips,x=”total_bill”).add(so.Bar(),so.Hist()).show()And here is the result:
-