Section outline
-
-
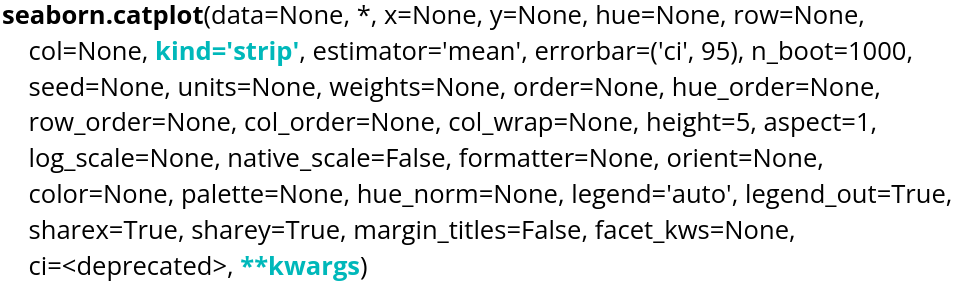
Parameter name Explanations Type required Example data table you are planning to use
DataFrame, Series, dict, array, or list of arrays data=table x variable of the table for the x-axis string corresponding to a variable of the table x="weight" y variable of the table for the y-axis string corresponding to a variable of the table y="height" kind type of plot desired string kind="swarm" There are several kind options that can be used:
- strip
- swarm
- violin
- box
- boxen
- point
- bar
- count
The "point" and "bar" plots display the mean along with its confidence interval. These are calculated using bootstrap resampling.
-